Shark Sandwich said...
OK, McGowdog. Let me explain to you how you are not understanding these numbers. This explains it using AA's triennial data.
Take out a calculator and draw yourself out a bell curve.
No, M.A. I'm not gonna get out a calculator and draw a bell curve. For one thing, a bell curve is what you use to show the the probablility about a mean or average, and may be good to track astronomical data or a sample of info for the purpose of charting a normal distribution. A better way to analyze the reliability vs failure of something, looking at a pretty Sigma 3 averaged chart tells us nothing. I'd like to describe another way of looking at data, like the reliability of a man-made medical devices, let's say.
[Insert yummy Red Herring for M.A. to chew on]Let's say that you've got the Conmed/Bard Argon Beam Coagulator 6400. You build a number of those and get them into the O.R. of say 1000 heavy trauma operating rooms across the country and track the reliability of the medical device/electrosurgery devices.
It's gonna look like a bell-curve if you go out far enough. But we like to call it a bath-tub curve. Let's say that we're tracking failure rates instead of "retention" or reliability rates. The higher the failures, the higher the data goes on the y-axis (number of failures) vs time (x-axis). It always ends up as a bathtub curve.
You start off with a lot of failures in the beginning of a product while still working out the design failures, assembly failures, component failures, QC/QA oversights, testing failures, R&D design failures, burn-in failures, etc. As you go along, you tweak the design, improve/upgrade the software, catch and improve assembly failures, improve components and/or change vendors where necessary, improve proceedures and for QC and QA via trend analysis, improve test proceedures, R&D does their thing to improve designs, upgrades, etc, ... to where the high failures drop dramatically and you've got a device that goes for years and years with minimal failure.
Then... somewhere out at the end of its life, components start to die at such a rate that you retire the device. That's bathtub curve and I suppose you could make a bell curve in such a fashion.[End Red Herring]
Some of you may be atheists and all. But do you really want to rate a real live human being the same way? What's the predictible outcome of God, let's say? What kind of curve would you use for That?
Naw Ma. Let's not reinvent the wheel, shall we?
Like it or not, there were a couple of reasons for the survey, which started back in 1968.
1. “To enable A.A. to furnish more accurate data about the Fellowship and its effectiveness to the growing number of professional – doctors, psychiatrists, social workers, law enforcement officials and others – who are working today in the field of alcoholism.”
2. “To provide A.A. with more information about itself so that members can work more effectively in helping the many millions of alcoholics who still suffer throughout the world.”
This was back when we had PI (Public Information) committees, but no C.P.C. (Cooperation with the Professional Community) representation.
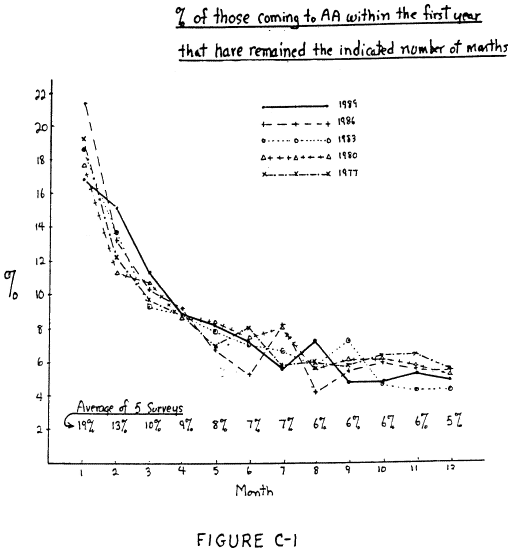
The C-1 graph data was never intended to be retention percentages in the first place and has been the fodder for reckless antiAAer claims.
Each of the 5 Triennial Surveys is a cross-sectional study - a snapshot at one point in time for 1977, 1980, 1983, 1986, and 1989. Assume that the same number of new people have been attending their first meetings every month. That is how many will be in their first month when the observation is made. Or as the chart says, “% of those coming into A.A. within the first year that have remained the indicated number of months, with the y-axis going from 2 to 22, expressed as a %, in two % increments, then the x-axis going from 1 month to 12 months in 1 month increments and the data depicting the average of the 5 surveys starting at 1 month and going to 12 months…
1 month; 19%
2 months; 13%
3 months; 10%
4 months; 9%
5 months; 8%
6 months; 7%
7 months; 7%
8 months; 6%
9 months; 6%
10 months; 6%
11 months; 6%
12 months; 5%
Rounding error shows 102% or 103%.
The ratio of the second month people in the survey to the first month people is the retention rate between the first and second months. In that same way, it is possible to find the retention between any two sampled months.
In the actual data presented: Month1 = 19% does NOT mean that "81% (i.e. 100% - 19%) dropped out in a month as some sources claim.
Month3 = 10% does NOT mean that "90% (i.e. 100% - 10%) leave within 3 months and Month12 = 5% does NOT mean that "95% (i.e. 100% - 5%) stop active participation in AA inside of a year.
Instead, what the data does show is that for every 100 people surveyed with under a year since first attendance:
19% of that population were in their first month
13% were in their 2nd month
9% were in their 4th month
7% were in their 6th month
6% were in their 8th month
6% were in their 9th month
6% were in their 10th month
6% were in their 11th month
5% were in their 12th month
What is actually shown in the C-1 graph is that 56% of those who stay beyond three months are still active in AA at the end of a year. Other Survey results show even better retention rates after the first year.
You’d have to see the graph (Chart 1) for each individual graph for the respective surveys to understand. For example, the one shown is the distribution for all months. The 1st month distribution starts at 100% and goes down to 26% after 12 months. The 2nd month distribution goes from 100% at the 2nd month and goes down to 38%, 3rd month from 100% to 50%, 4th month from 100% to 56%...
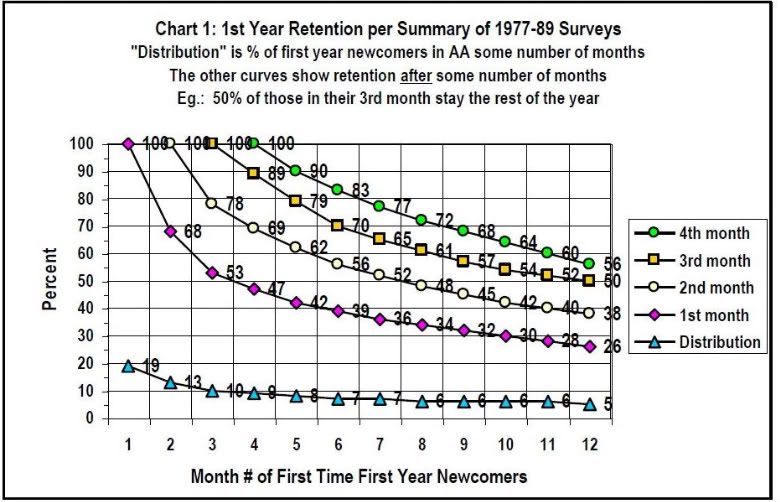
The normalizing factor, that which you multiply everything on the distribution by, is 5.25. So Tony J is correct in saying 26.25% after the first year.
Now, two more points the Triennial Survey points out;
As mentioned above,
• 56% of those who stay beyond 3 months are still active in A.A. at the end of a year and other surveys show even better.
• Another important consideration for data interpretation and context is that not everyone who attends A.A. meeting is an alcoholic.
They have graphs in there that show from 77’ to 80’ the percentages of different age groups have come into A.A. Less than 21 years of age, for example rose from 1% in 77’ to 3% for 83’ through 89’, less than 31 years of age rose from about 12% to 22% from 77’ to 89’, 31-50 year olds have been a pretty steady 55% from 77’ to 89’, and 51 years + declined from about 37% in 77’ to about 24% in 89’.
Random suggests imprecision rather than the opposite, but in actuality, when it comes to voting polls, for example, comes to mean “absence of bias". Just because you have a larger sample, doesn’t make it more accurate. That’s what they’ve done with the above survey and it’s good enough for me.
Here’s two statements from A.A.’s Triennial Surveys that show progress in the fellowship;
“About 40% of the members sober less than a year will remain sober and active in the Fellowship another year.”
“Similarly, of the members sober five years, about 90% will remain sober and active in the fellowship another year.”
No prediction is made for those that do NOT remain active.
Length of Sobriety (Data of 1989 survey)
Sobriety Range_________% of Sample
0-1years______________34.5%
1-2 years______________13.3%
2-3 __________________9.8%
3-4___________________7.4%
4-5___________________5.8%
5-10__________________17.2%
10-15_________________6.8%
15-20_________________2.8%
20-25_________________1.0%
25-30_________________0.5%
30-35_________________0.3%
35-40_________________0.1%
40-45_________________0.1%
45+___________________0.0%
No response____________0.4%
Another bit of wonderful data; across the board, from less than a year sober to 45+ years sober, average meetings per week is 3.
I think I’m gonna go on a 36 meetings in 90 days campaign.
Or how about this? 90 meetings in 90 years? You like that?
Oh look! Attendance at Alcoholics Anonymous meetings may reduce depression symptoms (http://esciencenews.com/articles/2010/01/28/attendance.alcoholics.anonymous.meetings.may.reduce.depression.symptoms)
Look! There goes a fucking rabbit. Depression for who? The spouse? Fuckin’ dicknose fucks. That's what the fuck you get when you mix alcoholism with Psychology and Sociology.

__________________________________________________________
Ok. Now that the above concern is out of the way, I’d like to delve into blame guy’s claim of a falling fellowship in terms of numbers.
First of all, let’s look at what the NIAAA’s (National Institute on Alcohol Abuse and Alcoholism) NESARC survey, (National Epidemiologic Survey on Alcohol and Related Conditions) says about the hard drinker vs. what some of us A.A. types like to call the real alcoholic.
Just for shits and giggles, let’s call the hard drinker “alcohol abuse” and the real alcoholic “alcohol dependence”.
It’s fair to assume that for every alcoholic, there were about 0.68 hard drinkers… from just looking ahead and skipping a little algebra. In the next 10 years, there were about 1 hard drinker for about 0.81 alcoholics.
The NIAAA says “the number of American adults who abuse alcohol or are alcohol dependent rose from 13.8 million in 1991-1992 to 17.6 million in 2001-2002 (i.e. 8.5% of the population 18 years and older or about 1 in every 12 adults).”
A June 10, 2004 National Institutes for Health (NIH) News Release summarized the NESARC survey data as;
• 1991-1992; alcohol abuse; 5.6 million, alcohol dependence; 8.2 million, total; 13.8 million.
• 2001-2002; alcohol abuse; 9.7 million, alcohol dependence; 7.9 million, total; 17.6 million.
“In 2002, global A.A. membership was around 2.1 million (1.2 million in the US)."
"These membership numbers are likely understated; even so, it is a substantial quantitative indicator of A.A. success.”
So… the way I see it, we’re (A.A.) helping 1 of every 7 alcoholics or about 14.3% of them. The amount of real alcoholics went down a bit... maybe some died. The amount of posers-er!!!!!!!!!! hard drinkers actually almost doubled... from 92' to 2002. So if anything, A.A. meetings should actually be smaller. But... we've got some hard drinkers to run out first. Or another way to look at is is this... that will make more room for the real alcoholic that is still out there. Don't want to do A.A. via the steps or believe in God? Fine. Get the fuck out. We need the chair. Maybe then we'll get the recovery rates up even higher and the antiAAers will be all proud of us. I have a ... an epiphany! You hard drinkers? Go join an antiAA blog. They'll keep you busy.
So based on that, Blame, what were you saying?
